All Magazine Plants List 10-Year DPR STP ETP Air Control Who We Are Vision
Official Environmental Technology Magazine — 2026
Circular Economy · Net Zero · ESG · Remediation · Bio-CNG
JIGISHA
ENVIROCARE
Pvt. Ltd.  ·  EarthGuard 2026

"Deliver innovative environmental consultancy, technology, and services that promote sustainable development and circular economy at a global scale — 2025 to 2035."

$93B
Market by 2034
7.95%
Sector CAGR
5
Global Regions
₹550Cr+
2035 Target
EIA · PFAS · ZLD · Bio-CNG · IoT · Carbon Credits · ESG · Wastewater · Air Pollution · Remediation
Green Environment
2026 Edition

Full-Spectrum Environmental Solutions

From Environmental Impact Assessments and PFAS remediation to Zero-Liquid Discharge systems, Bio-CNG plants, carbon credit generation, and IoT-powered real-time monitoring — Jigisha Envirocare delivers every dimension of the sustainability transition for industries, governments, and communities worldwide.

Environmental Impact AssessmentPFAS Remediation Zero Liquid DischargeBio-CNG Plants Carbon CreditsESG Audits IoT SensorsAir Pollution Control Wastewater TreatmentCircular Economy DesalinationSustainability Reporting Environmental Impact AssessmentPFAS Remediation Zero Liquid DischargeBio-CNG Plants
$93B
Env. Consulting (2034)
$958B
Env. Tech Market (2030)
$250B+
PFAS Remediation Market
360 TPD
Bio-CNG Capacity (Yr 5)
400K MT
CO₂ Avoided / Year
2035
₹550 Cr Target Year
Contents
TABLE OF CONTENTS
Multi-page mode enabled: each chapter opens as its own structured page using the top navigation, while All Magazine keeps every section and every data table available in one continuous edition.
01 About Jigisha Envirocare — Vision, Mission & Group Ecosystem 02 Environmental Consulting & Compliance Services 03 Environmental Technology Solutions — Air, Water, PFAS & IoT 04 Waste & Resource Management — Circular Economy 05 Bio-CNG Plants DPR — Four Models, 22 Plants, 360 TPD
06 Carbon Finance, ESG & Sustainability Reporting 07 Water Solutions — ZLD, Desalination & Smart Water Tech 08 Industry Sectors & Global Target Markets 09 Market Intelligence, Financials & Growth Strategy 10 2025–2035 Milestone Roadmap & Investment Plan 11 Impact Gallery, Revealed Data Room & Field Casebooks 12 Contact Us & Consultation Enquiry
New Technical Annex Chapters
COMPLETE PLANTS, DPR, TECHNOLOGIES & 10-YEAR PROJECTIONS
01
Chapter 01 · Company Overview

JIGISHA
ENVIROCARE
Pvt. Ltd.

Jigisha Envirocare Pvt. Ltd. is the dedicated environmental technology and sustainability solutions subsidiary of the Jigisha Group — built to deliver transformative environmental services, technology, and consulting across India and global markets through 2025–2035.

Green forest and clean water landscape
Company Vision

From compliance to regeneration

A high-impact environmental solutions platform combining consulting, technology, finance and global delivery infrastructure.

Jigisha Envirocare - Protecting the Planet
🌍 Forest Restoration & Natural Capital — Protecting Our Planet, One Solution at a Time
Brand Identity
OUR MISSION

"Deliver innovative environmental consultancy, technology, and services that promote sustainable development and circular economy at a global scale."

Founded as part of the Jigisha Group's 19+ subsidiary ecosystem, Jigisha Envirocare Pvt. Ltd. operates at the intersection of environmental science, engineering technology, and financial innovation — providing the full spectrum of services required for industries, municipalities, and corporations to achieve genuine, measurable, and verifiable environmental compliance and net-zero transformation.

IndiaMEASE Asia Latin AmericaEastern Europe 2025–2035 Roadmap
Green Infrastructure Vision
BUILDING A GREEN FUTURE

Jigisha Envirocare envisions a world where industrial growth and environmental responsibility are not in conflict, but are deeply intertwined. Every factory can be zero-liquid-discharge. Every city can have clean air. Every unit of agricultural waste can become clean energy and organic fertilizer. Our role is to make that vision an engineered, financed, and operated reality — city by city, industry by industry, ecosystem by ecosystem.

🌍 Global Presence

Operations across 5 major regions: India, MEA, Southeast Asia, Latin America, Eastern Europe — with a unified technology and consulting delivery platform.

⚙️ Technology-Led

IoT sensors, AI-powered monitoring, PFAS remediation modules, ZLD systems, and digital environmental dashboards at the core of every engagement.

Jigisha Envirocare Green City
🏙️ Renewable Infrastructure — Clean Power, Green Cities & Sustainable Operations
Corporate Identity & Strategy
WHO WE ARE

Jigisha Envirocare Pvt. Ltd. (JEPL) is the environmental technology, consulting, and sustainability solutions arm of the Jigisha Group of Companies — operating under the flagship holding entity Jigisha Infotech Pvt. Ltd. (JIPL). JEPL's creation reflects the Jigisha Group's conviction that environmental sustainability is not merely a compliance obligation but a massive, multi-decade commercial opportunity that rewards companies with deep technical capability, financing innovation, and global delivery infrastructure.

JEPL combines four competitive advantages that most environmental services firms lack: (1) the environmental science and engineering expertise of a specialist consultancy; (2) the manufacturing and technology integration capability to deploy modular water, air, and waste treatment systems at scale; (3) the financial innovation to structure carbon credit monetisation, payment-for-ecosystem-services (PES), and green finance instruments that reduce client CAPEX; and (4) the global reach of Jigisha International's 180+ country network to deliver projects in MENA, Africa, Southeast Asia, Latin America, and Eastern Europe.

The company's service portfolio spans the complete environmental value chain — from pre-project Environmental Impact Assessments (EIA) and regulatory permitting, through technology deployment (wastewater treatment, air pollution control, PFAS remediation), to post-implementation monitoring (IoT sensor networks, real-time dashboards), carbon credit generation, and ESG reporting — making JEPL the single-window environmental solutions partner for large-scale industrial and public-sector clients.

JEPL's strategy for 2025–2035 is built on six converging trends: escalating global environmental regulation, corporate ESG disclosure mandates, the PFAS contamination crisis ($250B+ remediation market), growing demand for industrial Zero-Liquid Discharge systems, the explosive growth of the voluntary carbon market, and India's ambitious smart city, clean energy, and industrial corridor programmes that require world-class environmental management to proceed legally and sustainably.

Ecosystem Advantage
JIGISHA GROUP SYNERGY

Jigisha Envirocare is uniquely positioned by its integration within the Jigisha Group's 19-subsidiary ecosystem — drawing on engineering (Jigisha Engineering), electrical systems (JEEPL), digital platforms (Jigisha Infotech), international commerce (Jigisha International), agri-energy (Jigisha Agro Bio-CNG), and project finance (Jigisha Infin).

🏗️ Jigisha Engineering

Civil and mechanical engineering capability for constructing wastewater treatment plants, Bio-CNG facilities, air pollution control units, and ZLD plant infrastructure — enabling turnkey EPC delivery for environmental projects of any scale.

  • Wastewater plant civil construction
  • Bio-CNG plant EPC delivery
  • ZLD system mechanical installation
  • HAZOP and safety review integration

💻 Jigisha Infotech

Develops the IoT sensor platforms, real-time environmental monitoring dashboards, AI-powered emission prediction models, and digital twin systems that transform raw sensor data into actionable environmental compliance intelligence.

  • Real-time air/water quality dashboards
  • AI-based emission forecasting
  • Digital twin for treatment plants
  • Carbon tracking & reporting SaaS

🌍 Jigisha International

Provides cross-border project delivery capability, international tender participation, government-to-government environmental programme facilitation, and access to EU, World Bank, ADB, and UN-funded environmental project opportunities across 180+ countries.

  • MENA environmental EPC projects
  • Africa off-grid clean water delivery
  • World Bank/ADB funded programmes
  • Carbon credit international trading
19+
Group Subsidiaries
All supporting JEPL projects
180+
Countries via JIPL
Global project delivery
₹550Cr+
Revenue Target (2035)
Consolidated turnover
5
Target Regions
India, MEA, SE Asia, LATAM, EU
02
Chapter 02 · Environmental Consulting

ENVIRONMENTAL
CONSULTING
& Compliance

JEPL's Environmental Consulting & Compliance division is the foundation of every client relationship — providing rigorous scientific assessments, regulatory compliance management, and strategic sustainability advisory that protects clients from regulatory risk while positioning them for long-term environmental leadership.

Environmental consultants reviewing plans
Consulting Desk

Compliance intelligence before project risk

EIA, permitting, audits, ESG due diligence and climate resilience planning built into one advisory workflow.

Environmental Consulting
Core Service
EIA & Due Diligence
Comprehensive Environmental Impact Assessments for industrial, infrastructure, and real estate projects
Compliance Management
Regulatory
Permitting & Compliance
Air, water, soil permits and ongoing compliance management across all regulatory frameworks
ESG Auditing
ESG & Sustainability
ESG Audits & Reporting
Third-party verified ESG audits, sustainability reports, and net-zero strategy development
Consulting Services Portfolio
ENVIRONMENTAL CONSULTING SERVICES
📋
ENVIRONMENTAL IMPACT ASSESSMENT (EIA)
Comprehensive EIAs for industrial facilities, infrastructure projects, mining operations, and real estate developments — covering baseline studies, impact prediction, mitigation measures, and public consultation management per MoEF&CC norms and international standards (IFC PS, ESIA).
  • Scoping, baseline surveys, impact matrix preparation
  • Air quality, water, noise, ecology, socio-economic studies
  • Environmental Management Plan (EMP) development
  • Public hearing support and stakeholder engagement
  • MoEF&CC, State Pollution Control Board approvals
  • IFC Performance Standards compliance (international projects)
  • ESIA for World Bank/ADB funded infrastructure
MoEF&CCSPCBIFC PSESIA
⚖️
PERMITTING & COMPLIANCE MANAGEMENT
End-to-end regulatory permitting and ongoing compliance management for all environmental consents — air emissions, effluent discharge, hazardous waste handling, noise, and green building certifications — reducing legal exposure and inspection risk for industrial operators.
  • Consent to Establish (CTE) and Consent to Operate (CTO)
  • Stack emission testing & compliance reporting
  • CEMS (Continuous Emission Monitoring) installation
  • Effluent Quality Monitoring & NORMS compliance
  • Hazardous waste licensing (HWMH Rules 2016)
  • Environment Statement submission (Form V)
  • Green Building: LEED, GRIHA, EDGE certification support
CTE/CTOCEMSLEED/GRIHA
🔬
MONITORING, TESTING & ENVIRONMENTAL AUDITS
Comprehensive environmental monitoring and testing services — stack emission testing, ambient air quality monitoring, effluent characterisation, soil contamination assessment, groundwater quality surveys, noise mapping, and periodic third-party environmental audits with NABL-referenced laboratory analysis.
  • Stack emission testing (PM, SO₂, NOₓ, HCl, HF, Hg)
  • Ambient air quality (NAAQS compliance, PM2.5/PM10, VOC)
  • Industrial effluent characterisation (all CPCB parameters)
  • Soil and groundwater contamination mapping
  • Noise contour mapping and hearing conservation
  • Third-party environmental audits (manufacturing, mining, ports)
  • Due diligence audits for M&A transactions
NABLNAAQSDue Diligence
Compliance Framework
REGULATORY COMPLIANCE MATRIX
Compliance DomainKey RegulationsJEPL ServicesReporting FrequencyApplicable Sectors
Air Quality ComplianceEPA 1986, Air Act 1981, CPCB Standards, NAAQSStack testing, CEMS installation, dispersion modelling, compliance reportingHalf-yearly (stack), Quarterly (ambient)Power, Cement, Steel, Chemicals, Refineries
Water & EffluentWater Act 1974, CPCB/SPCB effluent standards, NGT ordersETP design, effluent monitoring, ZLD advisory, discharge consentMonthly (internal), Quarterly (regulatory)Textile, Pharma, Food, Tanneries, Electroplating
Hazardous WasteHW Rules 2016, E-waste Rules, Battery Waste RulesWaste inventory, licensing, manifest system, disposal trackingAnnual (Form 4), Event-basedAll manufacturing industries
Environment StatementEPA Rule 14 — Form V submissionAnnual data compilation, calculation, submission assistanceAnnual (30 September)All Red/Orange category industries
BRSR (ESG Reporting)SEBI BRSR mandate (Top 1000 listed companies)Data collection, materiality assessment, report drafting, third-party verificationAnnual (integrated with Annual Report)Listed companies, top 1000 by market cap
EIA ComplianceEIA Notification 2006 & amendments, MoEF&CCEC monitoring, Half-yearly compliance reports, site inspection facilitationHalf-yearly (EC monitoring report)Mining, Industry, Infrastructure, Real Estate
Climate Risk (TCFD)TCFD Framework, RBI Climate Risk CircularPhysical & transition risk assessment, scenario analysis, TCFD report preparationAnnual (with financial disclosure)Banks, NBFCs, Large Corporates

🌡️ Climate Adaptation & Resilience Planning

JEPL develops comprehensive climate adaptation strategies for industries, cities, and infrastructure projects — identifying physical climate risks (flooding, heat stress, drought), transition risks (carbon pricing, policy change), and designing resilience measures aligned to IPCC scenarios and the Paris Agreement 1.5°C pathway.

  • TCFD-aligned climate risk assessment
  • Physical and transition risk quantification
  • Climate-resilient infrastructure design advisory
  • Water security planning in stressed basins
  • Heat stress and urban heat island mitigation

📊 ESG Due Diligence & Strategy

Full-service ESG advisory — from materiality assessment and stakeholder mapping to goal-setting, KPI framework development, supply chain ESG audits, and third-party verified annual ESG reports aligned to GRI, TCFD, BRSR, SASB, CDP, and SBTi standards.

  • GRI / SASB aligned ESG report preparation
  • Science-Based Targets initiative (SBTi) goal-setting
  • Supply chain ESG audit programmes
  • CDP questionnaire submission support
  • Sustainability transformation roadmaps

🔍 Environmental Due Diligence (M&A)

Comprehensive environmental due diligence for mergers, acquisitions, and real estate transactions — Phase I and Phase II site assessments identifying contamination liabilities, compliance gaps, future capex obligations, and regulatory risk before transaction closure.

  • Phase I Environmental Site Assessment (records review)
  • Phase II Site Investigation (soil/groundwater sampling)
  • Contamination liability quantification
  • Regulatory exposure assessment
  • Remediation cost estimation for deal structuring
03
Chapter 03 · Environmental Technology

ENVIRONMENTAL
TECHNOLOGY
Solutions

JEPL's Environmental Technology Solutions division deploys engineered systems — wastewater treatment, air pollution control, PFAS remediation, ZLD, desalination, and IoT monitoring — that physically transform contaminated environments into compliant, resource-recovering, and clean infrastructure assets.

Environmental engineering and technology system
Technology Systems

Treatment assets that recover value

Engineered water, air, PFAS, desalination and IoT systems designed for measurable environmental outcomes.

Environmental Technology
Technology Portfolio

"Environmental technology that doesn't just treat pollution — it recovers resources, generates energy, and creates economic value from what was previously considered waste."

Market Size
Env. Tech Market (2030)$957B
Water Treatment Mkt$50.6B
PFAS Remediation$250B+
CAGR5.3–7.95%
Technology Portfolio
ENVIRONMENTAL TECHNOLOGY SOLUTIONS
💧
WASTEWATER TREATMENT SYSTEMS
Turnkey design, supply, and commissioning of wastewater treatment plants (WTP/ETP/STP) for municipal, industrial, and remote-site applications — using conventional (ASP, SBR) and advanced (MBR, MBBR) biological treatment technologies combined with tertiary polishing for ZLD or reuse.
  • Municipal STPs: conventional to advanced MBR (10 KLD–100 MLD)
  • Industrial ETPs: textile, pharma, food, tannery, electroplating
  • Packaged plants for remote sites (oil & gas, mining, defence)
  • MBBR (Moving Bed Biofilm Reactor) for space-constrained sites
  • SBR (Sequencing Batch Reactor) for variable flow applications
  • Tertiary treatment: sand filtration, ACF, UV disinfection
  • AMC/O&M contracts for long-term plant operation
MBRMBBRSBRZLD
🌬️
AIR POLLUTION CONTROL UNITS
Design and deployment of industrial air pollution control systems — from basic particulate matter (PM) capture to complex multi-pollutant abatement for power plants, cement works, and chemical plants — ensuring CPCB/SPCB compliance and meeting NGT emission limits.
  • Electrostatic Precipitators (ESP): power, cement, steel
  • Bag filters / fabric filters: fine particulate capture (<10mg/Nm³)
  • Wet scrubbers: acidic gas (SO₂, HCl, HF, NH₃) abatement
  • VOC abatement: RTO (Regenerative Thermal Oxidiser), carbon adsorption
  • Cyclones and multi-clones: coarse PM pre-treatment
  • CEMS installation: continuous real-time emission monitoring
  • FGD (Flue Gas Desulfurisation) for coal power plants
ESPFGDRTOCEMS
☣️
PFAS & EMERGING CONTAMINANT REMEDIATION
PFAS (Per- and Polyfluoroalkyl Substances) — "forever chemicals" — represent a $250B+ remediation market driven by regulatory mandates in the US, EU, and now India. JEPL's PFAS remediation module uses advanced treatment technologies to destroy or capture PFAS from groundwater, soil, and industrial effluent.
  • PFAS site investigation and risk characterisation
  • Granular Activated Carbon (GAC) filtration for PFAS removal
  • Ion Exchange Resin (IEX) for low-concentration PFAS capture
  • Foam Fractionation for PFAS concentration from water
  • Electrochemical Oxidation (ECO) for PFAS destruction
  • Soil washing and thermal treatment for soil PFAS
  • Long-term groundwater monitoring networks
PFASGACECORemediation
Digital Environmental Intelligence
IoT ENVIRONMENTAL SENSORS & REAL-TIME PLATFORMS
IoT Environmental Monitoring
Smart Monitoring
JEPL IoT PLATFORM

JEPL's IoT Environmental Monitoring Platform provides real-time, cloud-connected environmental intelligence for industrial facilities, cities, and regulatory compliance — powered by AI analytics, predictive modelling, and automated regulatory reporting.

  • 🌐 Multi-parameter sensors: PM2.5, PM10, SO₂, NOₓ, CO, O₃, VOC
  • 💧 Water quality: DO, BOD, COD, pH, TDS, heavy metals (online)
  • 📡 LoRa/4G/5G mesh connectivity (industrial-grade, IP67)
  • ☁️ Cloud SCADA with AI-powered anomaly detection
  • 📊 Automated CPCB-format compliance reports
  • 🚨 Real-time exceedance alerts (SMS/email/app)
  • 🔮 Predictive emission forecasting (ML models)
  • 🗺️ GIS-based pollution hotspot mapping
CPCB OnlineSCADA 4G/LoRaAI Analytics
Technical Specifications
TECHNOLOGY SYSTEMS — SPECIFICATIONS
Technology SystemCapacity RangeKey TechnologyTreatment StandardApplicationsJEPL Service Scope
Municipal STP (MBR)100 KLD – 50 MLDMBR (Hollow Fiber / Flat Sheet), UV DisinfectionBOD <5 mg/L, TSS <1 mg/L (Tertiary)Smart cities, housing societies, municipal councilsDPR, design, EPC, O&M, SCADA monitoring
Industrial ETP (ZLD)10 KLD – 5 MLDPrimary (DAF/Clari-floc) + Biological + RO + MEEZero discharge to environment, 100% reuseTextile, pharma, food, tanneries, dye industryTechnology selection, system design, EPC, ZLD audit
Electrostatic Precipitator1,000–5,00,000 m³/hrDry ESP, Wet ESP, two-stage ESPPM outlet <50 mg/Nm³ (dry), <20 mg/Nm³ (wet)Power plants, cement, steel, fertiliserDesign, fabrication, installation, performance guarantee
VOC Abatement (RTO)5,000–1,00,000 m³/hrRegenerative Thermal Oxidiser (1 or 3-chamber)99%+ VOC destruction efficiency, <20 ppm TOC outletChemicals, pharmaceuticals, printing, coatingEngineering, supply, installation, commissioning
PFAS Remediation Unit10 m³/day – 10,000 m³/day groundwaterGAC + IEX + ECO (Electrochemical Oxidation)PFAS below US EPA HAL (4 ppt PFAS sum)Industrial sites, airports, fire-fighting training areasSite investigation, system design, treatment, monitoring
IoT Monitoring Network1–500 monitoring nodesMulti-parameter sensors, LoRa/4G, cloud SCADACPCB online monitoring compliance (OCEMS format)Industries, smart cities, traffic corridors, riversSensor supply, installation, dashboard, reporting, maintenance
Desalination Plant (RO)100 m³/day – 100 MLDSWRO / BWRO + energy recovery devicePotable: TDS <500 mg/L, WHO drinking waterCoastal cities, islands, GCC water supply, industryFeasibility, design, EPC, long-term O&M
04
Chapter 04 · Waste & Resource Management

WASTE &
RESOURCE
Management

Waste is not a problem to be buried — it is a resource waiting to be recovered. JEPL's Waste & Resource Management division closes the circular economy loop — from solid waste collection and recycling to waste-to-energy conversion, composting, and resource recovery frameworks that generate revenue from what was once a disposal cost.

Circular waste and resource recovery plant
Circular Economy

Waste streams converted into resources

Material recovery, composting, RDF, waste-to-energy, industrial symbiosis and resource monetisation.

Waste Management Services
WASTE & CIRCULAR ECONOMY PORTFOLIO
♻️
SOLID WASTE MANAGEMENT (SWM)
End-to-end solid waste management solutions for municipalities and industries — from waste characterisation and collection system design to processing facility planning, material recovery facility (MRF) setup, and sanitary landfill design with leachate management.
  • Municipal solid waste (MSW) characterisation studies
  • Integrated Solid Waste Management (ISWM) plan preparation
  • Source segregation and door-to-door collection system design
  • Material Recovery Facility (MRF) design and operations
  • Engineered sanitary landfill design (lined, with LFG capture)
  • Leachate treatment system design and commissioning
  • Door-to-door collection fleet optimisation (GPS-enabled)
WASTE-TO-ENERGY (WtE) CONVERSION
Converting non-recyclable solid waste into usable energy — through incineration with energy recovery (W-t-E plants), refuse-derived fuel (RDF) production, gasification, and pyrolysis — reducing landfill dependency while generating electricity or heat for industrial use.
  • W-t-E plant feasibility and DPR preparation
  • RDF (Refuse Derived Fuel) plant design and commissioning
  • Gasification systems for biomass and MSW fractions
  • Pyrolysis for plastics and agri-waste conversion
  • Landfill gas (LFG) capture, purification, and utilisation
  • Co-processing in cement kilns (AFR management)
  • Power Purchase Agreement (PPA) facilitation for WtE output
🌱
COMPOSTING & ORGANIC WASTE RECOVERY
Biological treatment of organic waste streams — through windrow composting, vermi-composting, anaerobic digestion (biogas/Bio-CNG), and liquid organic fertiliser production — creating high-value organic products from kitchen waste, agri-residue, and food processing effluents.
  • Decentralised composting units (100 kg/day – 10 TPD)
  • Windrow composting for large-scale municipal organic waste
  • Vermi-composting systems for high-value organic fertiliser
  • Biogas plants (anaerobic digestion) for wet organic waste
  • Bio-CNG plants (see Chapter 05) for agricultural residue
  • Liquid bio-fertiliser (effluent from digestion) recovery
  • Certification for compost quality (FCO standards)
Strategic Framework
CIRCULAR ECONOMY CONSULTING FRAMEWORK

JEPL's Circular Economy consulting framework helps industries and municipalities map material flows, identify resource recovery opportunities, design closed-loop systems, and monetise secondary resources — moving from a linear "take-make-dispose" model to a circular model where every output becomes an input.

🗺️ Material Flow Analysis

Comprehensive mapping of all material inputs, products, by-products, and waste streams within an industrial facility or urban system — quantifying mass flows, identifying waste hotspots, and calculating the economic value of currently wasted resources.

  • Industrial symbiosis opportunity identification
  • Waste exchange programme design
  • By-product valorisation pathway assessment
  • EPR (Extended Producer Responsibility) planning

💰 Resource Recovery Economics

Financial modelling of resource recovery investments — calculating ROI, payback periods, and carbon credit value for waste-to-resource projects — making the business case for circular economy investments compelling for CFOs and boards.

  • Resource recovery project DPRs
  • Revenue from secondary material sales
  • Carbon credit value from waste diversion
  • Government scheme (MSME, NABARD) utilisation

🏭 Industrial Symbiosis Networks

Facilitating industrial symbiosis — where one company's waste becomes another company's raw material — creating economic value and reducing total waste disposal costs across industrial clusters, SEZs, and industrial parks.

  • Waste exchange network design
  • By-product offtake agreement facilitation
  • Industrial estate waste minimisation plans
  • Co-processing and AFR programme management
"Every litre of contaminated water treated, every tonne of waste converted to energy, every carbon credit generated — is not just a business metric. It is a measurable act of planetary stewardship."
— Jigisha Envirocare Pvt. Ltd. — Environmental Promise 2026
05
Chapter 05 · Bio-CNG DPR

BIO-CNG
PLANTS
DPR 2025

Jigisha Envirocare's Bio-CNG Plant programme — developed in coordination with Jigisha Agro Industries' Sustainability & Bio-Energy Business Unit — establishes a portfolio of bio-CNG production plants converting agricultural waste into clean compressed natural gas, organic fertiliser, and carbon credits. 22 plants. 360 TPD. ₹101.50 Cr investment. December 2025 DPR.

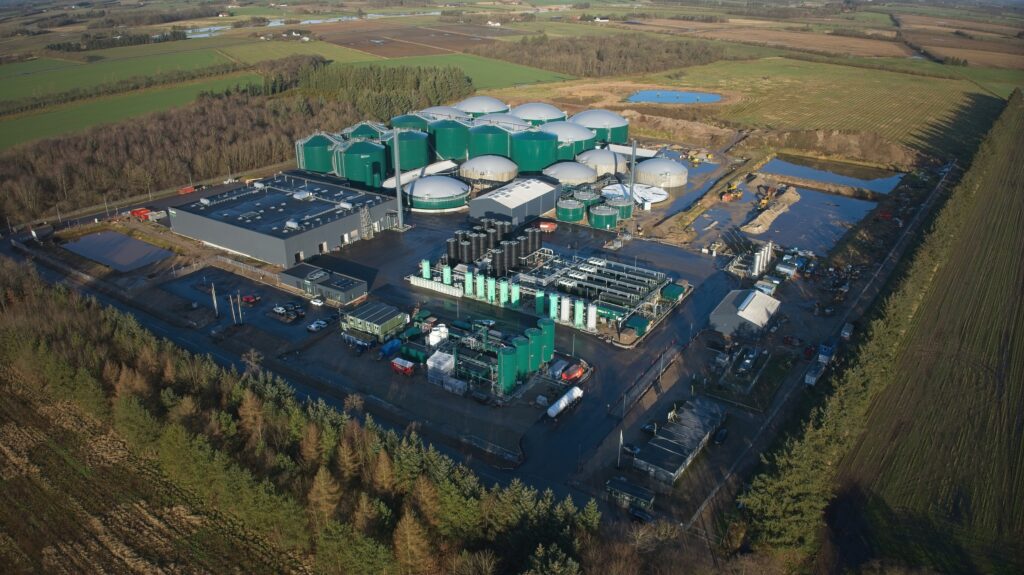
Drone view of a large biogas and biomethane plant
Bio-CNG Infrastructure

Agri-waste to biomethane at industrial scale

Drone-scale plant imagery reinforces the 22-plant Bio-CNG roadmap, feedstock logistics and clean-fuel vision.

Biogas Plant Technology
Bio-CNG Technology

"Anaerobic digestion of agricultural residue: 60% agri waste + 40% livestock dung → Biogas → Gas purification (95%+ CH₄) → Compression (20–200 bar) → Bio-CNG for vehicles + Organic compost for farms."

22-Plant Summary
Total Investment₹101.50 Cr
Aggregate Capacity360 TPD
5-Year Revenue₹76.80 Cr
Cumulative Profit₹8.25+ Cr
Jobs Created180+ direct
CO₂ Avoided400K MT/yr
Four Standardised Plant Models
BIO-CNG PLANT FINANCIAL MODELS
10
TPD Pilot Model
Total CAPEX₹2.80 Cr
Annual OPEX₹2.00 Cr
Land Required1.5 Acres
Year 5 Revenue₹1.68 Cr
Payback Period4.2 Years
IRR28%
Compost/Year1,000 MT
Compost Revenue₹40 Lakh
Year 1 Pilot
25
TPD Scale-Up Model
Total CAPEX₹5.60 Cr
Annual OPEX₹4.36 Cr
Land Required2.8 Acres
Year 5 Revenue₹4.20 Cr
Payback Period3.8 Years
IRR31%
CNG Price₹20,000–23,000/MT
Vehicles/Day60–80 vehicles
Year 2 Scale-Up
50
TPD Recommended Focus ★
Total CAPEX₹9.80 Cr
Annual OPEX₹6.17 Cr
Land Required5.0 Acres
Year 5 Revenue₹8.40 Cr
Payback Period3.4 Years
IRR34%
Compost/Year5,475 MT
Compost Revenue₹1.64 Cr
HIGH PROFITABILITY
100
TPD Maximum Returns ★★
Total CAPEX₹16.50 Cr
Annual OPEX₹10.60 Cr
Land Required8.5 Acres
Year 5 Revenue₹16.80 Cr
Payback Period3.1 Years
IRR37%
Compost/Year10,950 MT
Compost Revenue₹2.74 Cr
MAXIMUM RETURNS
Deployment Strategy
5-YEAR PHASED DEPLOYMENT PLAN
YearPhasePlant ConfigurationInvestmentAggregate CapacityCumulative Plants
Year 1Pilot Phase1 × 10 TPD plant₹2.80 Cr10 TPD1 plant
Year 2Scale-Up2 × 25 TPD + 1 × 10 TPD₹17.60 Cr (cumulative)60 TPD4 plants
Year 3Expansion3 × 25 TPD + 2 × 50 TPD₹27.60 Cr (year 3 addition)160 TPD9 plants
Year 4–5Full DeploymentMix of 50 TPD + 100 TPD plants₹53.50 Cr (final phase)360 TPD22 plants
TOTALComplete Deployment22 Plants (all models)₹101.50 Cr360 TPD22 Plants
GOVERNMENT SUPPORT & SCHEMES
SchemeSupportAgency
Pradhan Mantri Bio-CNG₹5,000–10,000/MT subsidy on Bio-CNG productionMoPNG
Swachh Bharat MissionWaste management project grants & viability fundingMoHUA
Ministry of PetroleumBio-fuel promotion: feed-in tariff, priority grid connectionMoPNG
MNRE GOBARDHANGreen energy co-pilot grant for biogas/Bio-CNG plantsMNRE
NABARD Soft Loan4–6% interest soft loans for rural bio-energy projectsNABARD
FINANCING MIX (100 TPD Example)
Equity (Company) ₹4.95 Cr (30%)
Bank Debt ₹7.15 Cr (43%)
Government Subsidy ₹2.75 Cr (17%)
Green Finance ₹1.65 Cr (10%)
Environmental & Social Impact
CUMULATIVE IMPACT — 22 PLANTS, 360 TPD, 5 YEARS
131,400
MT/Year Agri Waste Processed
Eliminating stubble burning in 22 districts
80,000+
Farmers Earning Income
₹80K–2L/year from feedstock supply
400K MT
CO₂ Avoided Per Year
Through bio-energy substitution
50,000 MT
Compost Returned to Farms
Improving soil fertility across regions
360 TPD
Daily Processing Capacity
Full deployment Year 5
180+
Direct Jobs Created
+ 500+ indirect livelihoods
₹76.80 Cr
5-Year Cumulative Revenue
Across all 22 plants
Q3 2026
Pilot Plant Go-Live
Board approval pending

🎯 Phased Rollout Strategy (DPR Recommendation)

Start with 10 TPD pilot (Year 1) for operational learning → scale to 50 TPD (Years 2–3) for rapid market expansion → deploy 100 TPD mega-plants (Years 4–5) for maximum IRR of 37%. This sequencing minimises risk while maximising long-term returns.

  • Year 1: 10 TPD pilot for operational learning
  • Years 2–3: 50 TPD plants — high profitability focus
  • Years 4–5: 100 TPD mega-plants — maximum returns
  • Parallel technology investment: PSA biogas upgrading, IoT monitoring

📍 Regional Clustering Strategy

Deploy multiple plants in the same district to share infrastructure, reduce overhead costs, and build critical mass for feedstock procurement. Negotiate offtake agreements with state energy departments and cooperative societies to ensure stable Bio-CNG demand and predictable revenue streams.

  • 2–3 plants per district for logistics efficiency
  • State energy department offtake MOUs
  • Cooperative society feedstock aggregation agreements
  • CNG filling station at each plant (60–80 vehicles/day)

BOARD ACTIONS PROPOSED (December 2025 DPR): ✓ Approve ₹101.50 Cr investment commitment ✓ Authorize 5-year deployment across 4 models ✓ Approve Government funding & partnership strategy ✓ Authorize site selection & environmental clearance process. Expected Go-Live: Q3 2026 (Pilot Plant Commissioning).

06
Chapter 06 · Carbon Finance & ESG

CARBON
FINANCE
& ESG

Carbon finance and ESG advisory are the highest-margin segments of JEPL's portfolio — combining carbon credit origination, verification, and trading with comprehensive corporate ESG strategy, BRSR reporting, science-based target setting, and climate risk advisory to create a multi-stream revenue business anchored in the global sustainability imperative.

Forest carbon and climate landscape
Carbon & ESG

Financeable climate outcomes

Carbon credits, ESG reporting, Scope 1-3 inventories, PES frameworks and assurance-ready data systems.

Carbon & ESG Portfolio
CARBON FINANCE & ESG SERVICES
🌍
CARBON CREDIT GENERATION & TRADING
End-to-end carbon credit programme development — from project design document (PDD) preparation and baseline calculation, through third-party verification (Verra VCS, Gold Standard, CDM), to credit issuance, registry management, and voluntary/compliance market trading.
  • Project Idea Note (PIN) and Project Design Document (PDD)
  • Baseline emission quantification and additionality demonstration
  • Verra VCS (Verified Carbon Standard) validation support
  • Gold Standard certification for community-benefit projects
  • India Carbon Market (ICM / PAT scheme) advisory
  • REC (Renewable Energy Certificate) management
  • Article 6 ITMO (Paris Agreement) project eligibility assessment
  • Carbon credit portfolio trading and monetisation strategy
VCSGold StandardICMITMO
📊
ESG STRATEGY & SUSTAINABILITY REPORTING
Full-service ESG strategy and reporting — from materiality assessment and stakeholder mapping to goal-setting, KPI framework development, supply chain ESG audits, and third-party verified annual sustainability reports aligned to global frameworks mandatory for listed companies and large borrowers.
  • BRSR (Business Responsibility & Sustainability Report) — SEBI mandatory
  • GRI Standards aligned sustainability report
  • SASB industry-specific disclosure metrics
  • CDP (Carbon Disclosure Project) questionnaire — all modules
  • SBTi (Science Based Targets initiative) goal setting
  • TCFD climate risk disclosure
  • Scope 1, 2 and 3 GHG inventory (ISO 14064)
  • Third-party assurance (limited/reasonable assurance)
BRSRGRISBTiTCFD
💰
PAYMENT FOR ECOSYSTEM SERVICES (PES)
Designing and structuring Payment for Ecosystem Services (PES) frameworks — where beneficiaries of environmental services (clean water, biodiversity, carbon sequestration) compensate the stewards of those services — creating sustainable financing for conservation and green infrastructure projects.
  • Watershed PES scheme design (upstream-downstream)
  • Forest carbon project development (REDD+, ARR)
  • Blue carbon (mangrove, seagrass) project development
  • Biodiversity offsets and net positive biodiversity planning
  • Agricultural soil carbon sequestration programmes
  • Green finance structuring: green bonds, sustainability-linked loans
  • Environmental fund management & governance frameworks
REDD+Blue CarbonGreen Bonds
Carbon Market Intelligence
GLOBAL CARBON MARKET OPPORTUNITY
Market Segment2024 Market Size2030 ProjectionKey DriversJEPL Opportunity
Voluntary Carbon Market (VCM)$2B (credits retired)$50–100BCorporate net-zero commitments, RE100, SBTi targetsCredit origination from Bio-CNG, WtE, PFAS avoided emissions
India PAT Carbon Market₹2,000–5,000 CrGrowing with ICM expansionSEBI-approved ICM, BEE PAT scheme Phase VIIEnergy efficiency project credits for industrial clients
REDD+ Forestry Carbon$300M annually$5–10BForest nations' NDCs, biodiversity conventionPES framework design for state forest departments
Blue CarbonEarly market <$50M$1–5B by 2030Mangrove restoration mandates, coastal biodiversityIndia's 4,975 km coastline mangrove restoration projects
Soil CarbonEmerging <$100M$3B+ by 2030Regenerative agriculture, FAO soil health agendaAgricultural carbon with Jigisha Agro Fusion platform
Article 6 ITMOsPilot phase$50B+ by 2030Post-COP Paris Article 6.2/6.4 rulebookIndia-MEA bilateral carbon deals via Jigisha International
07
Chapter 07 · Water Solutions

WATER
SOLUTIONS
ZLD & Beyond

Water is the most critical environmental resource of the 21st century. JEPL's Water Solutions division addresses the full spectrum of industrial and municipal water challenges — from Zero-Liquid Discharge (ZLD) systems for industrial compliance, through desalination for water-scarce regions, to smart water management using IoT and AI for efficient resource use.

Water treatment infrastructure and clean water
Water Solutions

Zero discharge and water security

ZLD, desalination, smart water networks and reuse systems for cities, industries and arid regions.

Wastewater Treatment
Industrial
Zero Liquid Discharge
100% effluent recovery — MBR + RO + MEE/ATFD for textile, pharmaceutical, and food industries
Desalination
Water Security
Desalination Systems
SWRO/BWRO for arid regions — 100 m³/day to 100 MLD for coastal cities and industrial water security
Smart Water
Smart Infrastructure
Smart Water Networks
IoT-enabled pressure management, NRW reduction, real-time quality monitoring for city water systems
Water Technology Solutions
WATER SOLUTIONS PORTFOLIO
🔄
ZERO LIQUID DISCHARGE (ZLD)
ZLD systems achieve 100% effluent recovery — ensuring zero discharge to the environment while recovering high-quality water for reuse and salts for commercial sale or safe disposal. JEPL designs ZLD systems for India's most water-stressed industrial sectors.
  • Primary treatment: clarification, DAF (Dissolved Air Flotation)
  • Biological treatment: ASP, SBR, MBR
  • Membrane filtration: UF + RO (primary and secondary)
  • Brine concentration: MEE (Multi-Effect Evaporator)
  • Crystallisation: ATFD (Agitated Thin Film Dryer) for salt recovery
  • Solar evaporation ponds for final brine disposal
  • Recovered salt quality analysis and market placement
MBR+ROMEEATFDZLD

⚗️ Industrial ZLD Applications

  • Textile (reactive dye effluent — high colour, TDS)
  • Pharmaceuticals (high COD, API traces)
  • Food & Beverages (high BOD, suspended solids)
  • Tanneries (high Cr, sulphide, TDS)
  • Electroplating (heavy metals — Cr, Ni, Cu, Zn)
  • Power plants (cooling water blow-down, ash leachate)
  • Mining (acid mine drainage, process effluent)
🌊
DESALINATION FOR ARID REGIONS
Seawater and brackish water reverse osmosis (SWRO/BWRO) desalination plants for water-scarce regions — from small-scale community systems to large utility-scale plants for Indian coastal cities, Gulf region water security, and remote industrial sites.
  • SWRO plants: 500 m³/day to 100 MLD
  • Energy Recovery Device (ERD) for energy efficiency
  • BWRO for inland brackish groundwater
  • Solar-powered desalination for remote communities
  • Hybrid SWRO + thermal (MED/MSF) for GCC
  • Post-treatment: remineralisation for potable water
  • Brine management and marine discharge impact assessment
SWROBWROSolar RO

📡 Smart Water Management (IoT)

  • Smart meters and pressure management (NRW reduction)
  • Online water quality monitoring (turbidity, chlorine, pH)
  • SCADA-based water distribution network control
  • Leak detection and pipe condition monitoring
  • Predictive maintenance for pumps and motors
  • Digital twin for water treatment plant optimisation
08
Chapter 08 · Industry Sectors

INDUSTRY
SECTORS
& Markets

Jigisha Envirocare serves a diverse portfolio of industrial sectors, public agencies, and corporate clients — each with specific environmental compliance requirements, technology needs, and sustainability transformation aspirations. Our sector expertise enables us to deliver targeted, cost-effective solutions.

Renewable energy infrastructure across industries
Sector Playbook

Specialised verticals for each client type

From power and manufacturing to airports, railways, smart cities and corporate ESG programmes.

Sector Coverage
SPECIALIZED SECTOR VERTICALS
Power & Energy

ESP, FGD, ash handling, cooling tower effluent, CEA compliance, coal power to solar transition EIA

🏭
Manufacturing

ETP/ZLD systems, air pollution control, chemical management, ISO 14001, EPR compliance

🏗️
Construction

EIA for real estate/infra, C&D waste management, LEED/GRIHA green building, construction dust control

🛢️
Oil & Gas

ESIA for E&P, PFAS remediation at refineries, produced water treatment, flare minimisation

🏙️
Smart Cities

SWM systems, STPs, smart water networks, air quality networks, EV charging EIA, urban heat island mitigation

🚂
Railways

Metro EIA, railway station STP/waste management, track-side noise barriers, green station certification

✈️
Airports

PFAS groundwater (AFFF firefighting foam), noise mapping, EIA for runway expansion, waste management

🏢
Corporate ESG

BRSR/GRI/TCFD reporting, SBTi goal-setting, scope 1/2/3 inventory, net-zero transformation roadmap

Geographic Strategy
GLOBAL TARGET MARKETS
RegionKey CountriesPriority ServicesMarket DriverEntry StrategyRevenue Target (5yr)
India (Primary)All states; Smart Cities; Industrial Corridors; NE IndiaEIA, ZLD, ESG, Bio-CNG, Smart Water, Air Pollution, Carbon CreditsSPCB enforcement, NGT orders, Smart City Mission, BRSR mandateDirect sales + Jigisha Group subsidiaries₹200 Cr+
Middle East & Africa (MEA)UAE, Saudi Arabia, Qatar, Kenya, Nigeria, EthiopiaDesalination, wastewater reuse, ESG advisory, carbon finance, air qualityWater scarcity, Vision 2030, Africa SDG water targetsUAE JV (Jigisha International hub), G2G tenders₹150 Cr+
Southeast AsiaVietnam, Indonesia, Philippines, Malaysia, BangladeshWastewater treatment (textile/pharma), bio-CNG, solid waste, EIARapid industrialisation, ASEAN environmental standards tighteningJoint ventures with local environmental firms₹100 Cr+
Latin AmericaBrazil, Chile, Colombia, MexicoPFAS remediation, mining wastewater, carbon credits, ESG advisoryPFAS regulatory expansion, mining sector ESG pressureCarbon-finance backed project entry₹50 Cr+
Eastern EuropePoland, Romania, Czech Republic, HungaryPFAS cleanup (EU regulatory mandate), industrial ZLD, carbon trading (EU ETS)EU PFAS REACH restriction, EU ETS carbon pricingJV with European remediation firms (technology transfer)₹50 Cr+
09
Chapter 09 · Market Intelligence

MARKET
INTELLIGENCE
& Financials

Jigisha Envirocare operates in the world's fastest-growing services sector — global environmental consulting services are projected to nearly double from USD 46.67 billion (2025) to USD 92.85 billion by 2034, at a CAGR of 7.95%, driven by escalating regulation, ESG mandates, and the PFAS remediation crisis.

Market analysis and sustainability finance team
Market Intelligence

Growth numbers translated into strategy

Revenue streams, market size, margin mix, R&D, manufacturing and global expansion planning.

Market Size
GLOBAL ENVIRONMENTAL MARKET OPPORTUNITY
$46.7B
Env. Consulting (2025)
→ $92.85B by 2034
7.95%
Consulting CAGR
2025–2034
$957B
Env. Tech Market (2030)
5.3–5.4% CAGR
$250B+
PFAS Remediation (N. America)
Regulatory mandate driven
$50.6B
Water/Waste Services (2028)
From $35.2B in 2022 (CAGR 6.3%)
$50–100B
Voluntary Carbon Market (2030)
From $2B in 2024
Break-even
FY 2026–27 Projected
R&D + water/sensor investment
₹550Cr+
2035 Revenue Target
Consolidated turnover
Business Plan
FINANCIAL PROJECTIONS FY 2025–2032
Revenue StreamFY 2025FY 2026FY 2027–28FY 2029–30FY 2031–32+Margin
Environmental Consulting & EIA₹3–5 Cr₹10–18 Cr₹30–50 Cr₹70 Cr₹120+ Cr35–45%
Environmental Technology (ETP/ZLD/Air)₹5–8 Cr₹20–35 Cr₹60–100 Cr₹150 Cr₹250+ Cr15–25%
PFAS Remediation (Module)₹1–2 Cr₹8–15 Cr₹30–50 Cr₹80 Cr₹150+ Cr30–40%
Bio-CNG Plant Revenue (22 plants)₹0.5 Cr₹5–10 Cr₹20–40 Cr₹76.8 Cr₹120+ Cr25–35%
Carbon Credits & ESG Advisory₹1–2 Cr₹5–10 Cr₹20–35 Cr₹60 Cr₹100+ Cr40–55%
Water Tech (ZLD/Desalination/Smart)₹2–4 Cr₹10–20 Cr₹40–70 Cr₹100 Cr₹160+ Cr20–30%
IoT Sensor Platform (SaaS)₹0.5 Cr₹3–6 Cr₹15 Cr₹30 Cr₹70+ Cr50–65%
International Projects (MEA/LATAM/EU)₹1 Cr₹5–8 Cr₹20–40 Cr₹80 Cr₹150+ Cr25–35%
TOTAL REVENUE₹14–22 Cr₹66–122 Cr₹235–400 Cr₹646 Cr₹1,120 Cr+28–38% blended
Growth Strategy
FOUR-PILLAR GROWTH STRATEGY

🔬 R&D & Innovation Hub (Bengaluru, 2026)

Dedicated R&D facility for IoT environmental sensor systems, PFAS remediation technology, advanced water treatment, and sustainable energy systems — creating proprietary technology IP that differentiates JEPL from competitors and enables premium pricing on technology-led engagements.

  • IoT sensor prototyping lab (soil, water, air, noise)
  • PFAS electrochemical oxidation (ECO) technology development
  • Sustainable water tech innovation (membrane, bio-electrochemical)
  • Digital twin and AI/ML environmental modelling
  • Partnership with IIT Bengaluru, IISC, NEERI

🏭 Manufacturing Units (Bhopal/Noida, 2026–27)

Modular water and air treatment manufacturing plant — enabling JEPL to supply its own technology systems at significantly lower cost than importing foreign equipment, while building a product business alongside the services revenue stream.

  • Modular packaged ETP/STP units (10 KLD – 1 MLD)
  • IoT environmental sensor manufacturing
  • Electrostatic precipitator component fabrication
  • Bio-CNG plant components (digesters, scrubbers, compressors)
  • Export of packaged environmental systems to MENA, Africa

💳 Climate Finance Integration

Leverage carbon credit issuance, voluntary credits, and PES models to generate new revenue streams that reduce client CAPEX barriers — making large environmental projects financially self-sustaining through carbon finance and green bond structures.

  • Carbon credit origination from all JEPL projects
  • Green bond issuance for large ZLD/desalination projects
  • ESCO (Energy Services Company) model for air pollution control
  • PES frameworks for watershed and mangrove restoration
  • Green finance through Jigisha Infin partnership

🌐 Strategic Partnerships

Joint ventures and technology alliances with established European and American environmental firms — accessing proven technology, international credentials, and existing client relationships while providing India/Asia market entry and cost-competitive delivery capability.

  • JV with European PFAS remediation firm (technology access)
  • EMS tie-up with UAE/MENA operator for Middle East projects
  • Export EMS alliances in Eastern Europe
  • World Bank/ADB prequalification for bilateral aid projects
  • USAID/DFID environmental programme delivery partnerships
10
Chapter 10 · 2025–2035 Roadmap

2025–2035
MILESTONE
Roadmap

JEPL's 2025–2035 strategic roadmap is designed to build the company from a consulting-led startup into a ₹550 Cr+ integrated environmental technology, consulting, and bio-energy conglomerate — with operations across 5 global regions, proprietary technology products, and a carbon finance business that generates passive income.

Road through sustainable landscape
2035 Roadmap

From proof of concept to global scale

Milestones, investment gates, technology validation and regional expansion structured across a decade.

Year-by-Year Milestones
STRATEGIC MILESTONE TIMELINE
2025
Services Launch — Pilot Monitoring & Consulting Contracts
Company incorporation and services launch. First EIA consulting contracts (India). Pilot environmental monitoring contracts using IoT sensors. First ESG audit for listed company client. UAE pilot consulting mandate via Jigisha International. Initial team: 30 environmental scientists, engineers, and consultants. Bio-CNG 10 TPD pilot plant site selection and environmental clearance application. Revenue target: ₹14–22 Cr.
2026
PFAS Module Launch · ZLD Projects · Carbon Credit Pilot · R&D Hub
PFAS remediation module deployed (first client: industrial site, Maharashtra). ZLD system projects commenced (textile and pharmaceutical sectors). Carbon credit pilot registration — first JEPL-originated credits verified (Verra VCS). R&D and Innovation Hub commissioned in Bengaluru. Modular manufacturing plant started (Bhopal). Bio-CNG 10 TPD pilot commissioned (Q3 2026 target). Break-even projected by FY 2026–27. Revenue target: ₹66–122 Cr.
2027–28
MENA, Africa & SE Asia Scale-Up · Remediation Mandates
Scaling full-service capabilities across MENA, Africa, and Southeast Asia. Securing remediation mandates from industrial clients and government agencies. Bio-CNG plants expanded to 10–12 operational (60–160 TPD). First carbon credits monetised in voluntary market ($5–10M value). PFAS remediation revenue accelerates on EU regulatory mandate. IoT sensor SaaS platform reaches 100+ active client sites. Manufacturing plant at full capacity — exporting packaged ETPs to UAE, Kenya. Revenue target: ₹235–400 Cr.
2029–30
Latin America & Eastern Europe Entry · Carbon-Finance Backed Projects
Enter Latin American markets — Brazil (PFAS in mining regions), Chile (copper mine wastewater), Colombia (ESG advisory for oil & gas). Eastern Europe entry — Poland and Romania for EU-mandated PFAS cleanup and carbon trading. Carbon-finance backed sustainability projects in Africa (watershed restoration PES). Bio-CNG portfolio reaches 22 plants, 360 TPD. Revenue target: ₹646 Cr.
2032–35
₹550 Cr+ Consolidated Turnover · M&A / Partial Stake Sale
Achieve ₹550 Cr+ consolidated turnover (likely exceeded by ₹1,000 Cr+ if carbon market materialises as projected). Explore M&A — acquisition of European PFAS firm for technology and credential consolidation, or partial stake sale to global environmental fund for growth capital. JEPL listed as India's most comprehensive environmental solutions company. Bio-CNG portfolio generating passive income. IoT platform SaaS revenue at ₹70+ Cr annually. Global team of 1,000+ environmental professionals.
Phase Architecture
THREE-PHASE GROWTH ARCHITECTURE
Phase 1
2025–2026 · Establish

Foundation & Proof of Concept

  • ✦ Services launch (India + UAE pilot)
  • ✦ EIA and ESG consulting revenue
  • ✦ PFAS module deployment
  • ✦ R&D Hub Bengaluru (2026)
  • ✦ First Bio-CNG plant (Q3 2026)
  • ✦ Carbon credit pilot registration
  • ✦ Break-even achieved (FY 2026–27)
Phase 2
2027–2029 · Scale

Global Scale-Up

  • ✦ MENA, Africa, SE Asia active
  • ✦ Remediation mandates secured
  • ✦ Bio-CNG portfolio: 22 plants
  • ✦ Carbon market monetisation
  • ✦ Manufacturing exports (packaged ETP)
  • ✦ IoT SaaS 100+ enterprise clients
  • ✦ Revenue target: ₹235–646 Cr
Phase 3
2030–2035 · Consolidate

Global Leadership

  • ✦ Latin America + Eastern Europe
  • ✦ ₹550 Cr+ consolidated revenue
  • ✦ M&A exploration / stake sale
  • ✦ Carbon finance passive income
  • ✦ 1,000+ global professionals
  • ✦ India's #1 integrated env. company
  • ✦ IPO / strategic fund round
Competitive Advantage
WHY JIGISHA ENVIROCARE WILL WIN

🔗 End-to-End Integration

By combining environmental consulting, technology-enabled remediation, carbon finance integration, and global project delivery capability, JEPL addresses a multi-hundred-billion-dollar opportunity with high-margin, sustainable offerings — something fragmented single-service competitors cannot match.

📋 Regulatory Tailwind

Growing global regulatory frameworks — PFAS REACH restriction (EU 2025), India's BRSR mandate, NGT ZLD orders, MoEF&CC CEMS requirements, TCFD climate disclosure — drive mandatory demand for JEPL's services that is non-cyclical and non-discretionary. Clients MUST comply.

💰 Carbon Finance Innovation

Embedding carbon credit origination and PES frameworks into environmental project delivery creates additional revenue streams that make large environmental projects financially self-sustaining — reducing client CAPEX barriers and creating passive income for JEPL's project portfolio.

🌐 Jigisha Group Infrastructure

JEPL is the only environmental company in India backed by a 19-subsidiary industrial conglomerate — providing engineering capability, digital technology, international commerce, logistics, and financial services that enable end-to-end project delivery no standalone environmental firm can offer.

⚗️ PFAS First-Mover

PFAS represents a $250B+ remediation market in North America alone — and as EU REACH restrictions and India's environmental standards tighten, the PFAS remediation market will explode across Asia. JEPL's early investment in PFAS technology creates a first-mover competitive advantage in an underserved Indian market.

💧 Water Scarcity Premium

Water scarcity is escalating across India, MENA, and Africa — making ZLD compliance systems, desalination plants, and smart water management technology not merely regulatory requirements but existential necessities for industrial and urban survival. JEPL's water technology portfolio is perfectly positioned for this mega-trend.

13
Chapter 13 · Complete Environment Care Plants

COMPLETE
ENVIRONMENT CARE
Plants List

A complete technical product annex has been added so the top menu now exposes every major plant and service category requested: STP, WTP, WWTP, industrial water, ETP, MRTP/MRCS, industrial waste, solid waste, recycling, air pollution control, IoT, Bio-CNG and financial DPR projections.

Environmental engineering control room and project planning
Complete Environment Care Plants

Technology, capacity, finance and delivery clarity

Every chapter now has a related visual header, DPR-style assumptions, specifications and next-step implementation data without changing the EarthGuard theme.

Extended Environment Care Plants Portfolio
COMPLETE PLANTS & TECHNOLOGIES

This annex expands the magazine into a practical product catalogue. It combines the existing EarthGuard content, Jigisha Envirocare website positioning, and market-led capability planning into one structured list covering water, wastewater, waste, recycling, air, remediation, river-cleaning and carbon-linked project models.

Integrated environmental engineering plant with industrial treatment systems
Integrated Delivery
FROM DPR TO EPC, O&M, MONITORING & CARBON VALUE

JEPL can position each plant as a full-service offer: feasibility, sampling, regulatory mapping, technology selection, process design, civil/mechanical/electrical integration, installation, commissioning, compliance monitoring, AMC/O&M and measurable impact reporting.

DPREPCO&MComplianceCarbon/ESG
Plant / ServiceGeneral Brief DescriptionCore TechnologyIndicative CapacityPrimary Output / KPI
Sewage Treatment Plants (STP)Domestic sewage treatment for townships, hotels, hospitals, campuses, stations, malls and municipalities.Screening, equalization, SBR/MBBR/MBR, disinfection, sludge handling, treated-water reuse.10 KLD–100 MLDBOD <10 mg/L, TSS <10 mg/L, reuse-ready tertiary output
Water Treatment Plants (WTP)Raw-water treatment for drinking, industrial process water and municipal supply.Intake, coagulation, clarifier, pressure sand filter, activated carbon, UF/RO/UV/chlorination.25 KLD–500 MLDBIS/WHO-aligned potable or process-water quality
Waste Water Treatment Plants (WWTP)Municipal and mixed wastewater infrastructure for reuse, river protection and smart cities.Primary, secondary, tertiary, nutrient removal, SCADA, sludge-to-energy integration.1 MLD–500 MLDReuse for gardening, flushing, cooling, industrial supply
Industrial Water Treatment PlantsProcess-water, boiler feed, cooling tower and high-purity industrial water systems.Softener, DM, RO, UF, EDI, degasser, dosing, silica/iron removal and automation.10 KLD–50 MLDReduced scaling, corrosion, blowdown and water cost
Effluent Treatment Plants (ETP)Industry-specific effluent treatment for pharma, textile, chemical, food, dairy, tannery and metal finishing.Equalization, pH correction, DAF, primary clarifier, anaerobic/aerobic, tertiary polishing.5 KLD–25 MLDCPCB/SPCB discharge or reuse compliance
Zero Liquid Discharge (ZLD)High-recovery systems that eliminate discharge and recover water/salts.UF, RO, brine RO, MEE, ATFD, crystallizer, salt handling, condensate reuse.10 KLD–10 MLD95–99% water recovery depending on feed quality
MRTP / MRCS River Cleaning SystemsMechanical River Treatment Plants / Mechanical River Cleaning Systems for floating waste, drains and riverfronts.Trash skimmer, floating boom, screens, conveyor, aeration, oil skimmer, drone/GIS mapping.0.5–50 km river stretchVisible river-cleaning impact with waste recovery records
Industrial Waste Management PlantsIndustrial hazardous/non-hazardous waste sorting, stabilization, recovery and disposal systems.Pre-processing, segregation, shredding, stabilization, leachate treatment, co-processing linkages.5–500 TPDManifest tracking, reduced landfill and better compliance
Solid Waste Management PlantsMunicipal solid waste processing including segregation, MRF, compost, RDF and landfill systems.MRF, trommel, ballistic separator, composting, RDF, biomethanation, leachate treatment.10–2,000 TPDLandfill diversion, compost/RDF revenue, civic compliance
Multi-Media Recycling PlantsMulti-category recycling for plastics, e-waste, paper, glass, metal, wood, textiles and C&D waste.Sorting, washing, shredding, granulation, baling, metal separation, product quality control.2–500 TPDMaterial recovery and saleable secondary raw material
Air Pollution Control SolutionsStack and fugitive-emission control for power, cement, steel, chemical, pharma and foundry sectors.ESP, baghouse, wet scrubber, dry scrubber, RTO, FGD, VOC adsorption, CEMS.1,000–500,000 m³/hrPM/SOx/NOx/VOC compliance with online reporting
PFAS & Soil/Groundwater RemediationEmerging contaminant treatment and site remediation.GAC, ion exchange, foam fractionation, pump-and-treat, soil washing, thermal/ECO.Site-specificRisk reduction, liability control and regulator-ready evidence
Source integration note: Jigisha Envirocare's public website describes the company as providing waste management, water treatment, renewable energy and sustainability consulting, with service areas covering solid/hazardous/e-waste, industrial and municipal wastewater, desalination, rainwater harvesting, air pollution control, monitoring, carbon/ESG, organic waste and IoT/AI-based environmental systems. This annex expands those public service categories into a presentation-ready product and DPR structure.
14
Chapter 14 · STP — Sewage Treatment Plants

STP
SEWAGE
Treatment Plants

STP systems convert domestic sewage into treated water suitable for reuse or safe discharge, reducing freshwater demand and protecting drains, lakes and rivers.

STP — Sewage Treatment Plants

Technology, capacity, finance and delivery clarity

Every chapter now has a related visual header, DPR-style assumptions, specifications and next-step implementation data without changing the EarthGuard theme.

STP — Sewage Treatment Plants visual
General Brief Description
STP PROJECT MODEL

STP systems convert domestic sewage into treated water suitable for reuse or safe discharge, reducing freshwater demand and protecting drains, lakes and rivers. The chapter includes a practical specification structure, deliverables and financial assumptions for board-level review and client presentation.

Design Capacity
10 KLD–100 MLD
Housing, hospitals, hotels, campuses, stations and municipalities.
Technologies
SBR / MBBR / MBR
Choose by land, influent load, reuse target and O&M capability.
Treatment Goal
BOD/TSS <10 mg/L
Tertiary polishing for flushing, gardening and cooling reuse.
Financial Model
EPC + 3–10 yr O&M
Recurring AMC, operator deployment, sludge and chemical management.

⚙️ Recommended Process Flow

  • Screen chamber and oil/grease trap
  • Equalization and flow balancing
  • Biological reactor: SBR/MBBR/MBR/UASB as suitable
  • Tertiary filtration, UV/chlorination and reuse tank
  • Sludge thickening, filter press, compost/co-processing linkage
  • SCADA/IoT monitoring for pH, flow, BOD/COD proxy and alarms

📋 DPR / Proposal Deliverables

  • Site survey, influent/input characterization and capacity design basis
  • Process flow diagram, mass balance, hydraulic calculations and electrical load
  • Equipment list, layout, civil/mechanical/electrical interface and automation concept
  • CAPEX, OPEX, payback, revenue model, risk register and implementation schedule
  • Compliance matrix, permits, monitoring plan and post-commissioning O&M model
15
Chapter 15 · WTP — Water Treatment Plants

WTP
WATER
Treatment Plants

WTP systems treat surface water, groundwater or industrial raw water into potable or process-quality water using clarification, filtration, membranes and disinfection.

WTP — Water Treatment Plants

Technology, capacity, finance and delivery clarity

Every chapter now has a related visual header, DPR-style assumptions, specifications and next-step implementation data without changing the EarthGuard theme.

WTP — Water Treatment Plants visual
General Brief Description
WTP PROJECT MODEL

WTP systems treat surface water, groundwater or industrial raw water into potable or process-quality water using clarification, filtration, membranes and disinfection. The chapter includes a practical specification structure, deliverables and financial assumptions for board-level review and client presentation.

Design Capacity
25 KLD–500 MLD
Municipal, township, industrial and institutional water supply.
Technologies
Clarifier + PSF/ACF + RO/UF
Modular process train based on turbidity, TDS, iron, hardness and microbes.
Treatment Goal
BIS/WHO aligned
Potable, boiler feed, process water or soft water quality.
Financial Model
EPC + consumables
Media, membranes, dosing chemicals, AMC and operator revenue.

⚙️ Recommended Process Flow

  • Raw water intake, screening and pumping
  • Coagulation/flocculation, tube settler/clarifier
  • Pressure sand filter, activated carbon filter, micron filtration
  • Softener/RO/UF/UV/chlorination as per end use
  • Storage, distribution, online turbidity/chlorine/pH monitoring
  • Preventive maintenance and membrane/media replacement plan

📋 DPR / Proposal Deliverables

  • Site survey, influent/input characterization and capacity design basis
  • Process flow diagram, mass balance, hydraulic calculations and electrical load
  • Equipment list, layout, civil/mechanical/electrical interface and automation concept
  • CAPEX, OPEX, payback, revenue model, risk register and implementation schedule
  • Compliance matrix, permits, monitoring plan and post-commissioning O&M model
16
Chapter 16 · WWTP — Waste Water Treatment Plants

WWTP
WASTE WATER
Treatment Plants

WWTP projects treat municipal and mixed wastewater at city scale, enabling reuse, river protection and smart-city water resilience.

WWTP — Waste Water Treatment Plants

Technology, capacity, finance and delivery clarity

Every chapter now has a related visual header, DPR-style assumptions, specifications and next-step implementation data without changing the EarthGuard theme.

WWTP — Waste Water Treatment Plants visual
General Brief Description
WWTP PROJECT MODEL

WWTP projects treat municipal and mixed wastewater at city scale, enabling reuse, river protection and smart-city water resilience. The chapter includes a practical specification structure, deliverables and financial assumptions for board-level review and client presentation.

Design Capacity
1–500 MLD
Municipal utilities, smart cities, river action plans and PPP projects.
Technologies
Primary + secondary + tertiary
Nutrient removal, tertiary reuse and sludge-to-energy options.
Treatment Goal
Reuse / river protection
Irrigation, industry, flushing, lake recharge and low-BOD discharge.
Financial Model
DPR + PPP + O&M
Long-term annuity, performance-linked payments and water reuse sale.

⚙️ Recommended Process Flow

  • City sewerage mapping and flow/load forecasting
  • Inlet works, primary settling and grit removal
  • Secondary biological treatment: ASP/SBR/MBBR/MBR
  • Nutrient removal and tertiary disinfection
  • Sludge digestion, dewatering and energy recovery options
  • SCADA, lab setup and public dashboard reporting

📋 DPR / Proposal Deliverables

  • Site survey, influent/input characterization and capacity design basis
  • Process flow diagram, mass balance, hydraulic calculations and electrical load
  • Equipment list, layout, civil/mechanical/electrical interface and automation concept
  • CAPEX, OPEX, payback, revenue model, risk register and implementation schedule
  • Compliance matrix, permits, monitoring plan and post-commissioning O&M model
17
Chapter 17 · Industrial Water Treatment Plants

INDUSTRIAL
WATER
Treatment Plants

Industrial water treatment protects boilers, cooling towers, process lines and product quality while reducing water consumption and plant downtime.

Industrial Water Treatment Plants

Technology, capacity, finance and delivery clarity

Every chapter now has a related visual header, DPR-style assumptions, specifications and next-step implementation data without changing the EarthGuard theme.

Industrial Water Treatment Plants visual
General Brief Description
INDUSTRIAL PROJECT MODEL

Industrial water treatment protects boilers, cooling towers, process lines and product quality while reducing water consumption and plant downtime. The chapter includes a practical specification structure, deliverables and financial assumptions for board-level review and client presentation.

Design Capacity
10 KLD–50 MLD
Boiler, cooling, process, pharmaceutical, food and electronics use.
Technologies
RO / DM / UF / EDI
Selected by TDS, hardness, silica, iron, microbes and conductivity target.
Treatment Goal
Reliable process water
Reduced scaling, corrosion, blowdown and production risk.
Financial Model
EPC + AMC
Consumables, membrane cleaning, resin regeneration and online monitoring.

⚙️ Recommended Process Flow

  • Raw-water chemistry and water balance study
  • Softener/DM/RO/UF/EDI selection and sizing
  • Chemical dosing for anti-scalant, corrosion and biocide control
  • Cooling tower side-stream filtration and blowdown reduction
  • Condensate recovery and reuse integration
  • Energy, chemical and water-saving dashboard

📋 DPR / Proposal Deliverables

  • Site survey, influent/input characterization and capacity design basis
  • Process flow diagram, mass balance, hydraulic calculations and electrical load
  • Equipment list, layout, civil/mechanical/electrical interface and automation concept
  • CAPEX, OPEX, payback, revenue model, risk register and implementation schedule
  • Compliance matrix, permits, monitoring plan and post-commissioning O&M model
18
Chapter 18 · ETP — Effluent Treatment Plants

ETP
EFFLUENT
Treatment Plants

ETP systems are industry-specific treatment plants that remove COD, BOD, colour, oil, heavy metals, solvents, salts and suspended solids from industrial wastewater.

ETP — Effluent Treatment Plants

Technology, capacity, finance and delivery clarity

Every chapter now has a related visual header, DPR-style assumptions, specifications and next-step implementation data without changing the EarthGuard theme.

ETP — Effluent Treatment Plants visual
General Brief Description
ETP PROJECT MODEL

ETP systems are industry-specific treatment plants that remove COD, BOD, colour, oil, heavy metals, solvents, salts and suspended solids from industrial wastewater. The chapter includes a practical specification structure, deliverables and financial assumptions for board-level review and client presentation.

Design Capacity
5 KLD–25 MLD
Textile, pharma, chemical, food, dairy, tannery, metal and engineering.
Technologies
DAF + biological + tertiary
Physico-chemical and biological train customized to effluent.
Treatment Goal
SPCB compliance / reuse
Discharge, CETP inlet, RO feed or ZLD integration.
Financial Model
DPR + EPC + O&M
High-value design, chemicals, operator deployment and performance audit.

⚙️ Recommended Process Flow

  • Detailed effluent characterization and treatability study
  • Equalization, neutralization, coagulation/flocculation
  • DAF/primary clarifier and oil removal
  • Anaerobic/aerobic biological treatment
  • Tertiary filtration, carbon, RO/ZLD where needed
  • OCEMS/CEMS integration and compliance reporting

📋 DPR / Proposal Deliverables

  • Site survey, influent/input characterization and capacity design basis
  • Process flow diagram, mass balance, hydraulic calculations and electrical load
  • Equipment list, layout, civil/mechanical/electrical interface and automation concept
  • CAPEX, OPEX, payback, revenue model, risk register and implementation schedule
  • Compliance matrix, permits, monitoring plan and post-commissioning O&M model
19
Chapter 19 · MRTP / MRCS — Mechanical River Cleaning

MRTP / MRCS
MECHANICAL RIVER
Cleaning Systems

Mechanical River Treatment Plants and Mechanical River Cleaning Systems remove floating waste, weed, silt load and drain contamination from rivers, lakes and canals while creating visible public impact.

MRTP / MRCS — Mechanical River Cleaning

Technology, capacity, finance and delivery clarity

Every chapter now has a related visual header, DPR-style assumptions, specifications and next-step implementation data without changing the EarthGuard theme.

MRTP / MRCS — Mechanical River Cleaning visual
General Brief Description
MRTP / MRCS PROJECT MODEL

Mechanical River Treatment Plants and Mechanical River Cleaning Systems remove floating waste, weed, silt load and drain contamination from rivers, lakes and canals while creating visible public impact. The chapter includes a practical specification structure, deliverables and financial assumptions for board-level review and client presentation.

Coverage
0.5–50 km stretch
Rivers, lakes, canals, ghats, drains and urban water bodies.
Technologies
Booms + skimmers + screens
Floating trash booms, trash skimmers, conveyors, aerators and silt traps.
Treatment Goal
Visible cleaning + data
Waste recovered, stretch cleaned, odour reduction and water-quality improvement.
Financial Model
City O&M contracts
Municipal contracts, CSR, riverfront authorities and monitoring retainers.

⚙️ Recommended Process Flow

  • Drone/GIS mapping of waste hotspots and drain inflows
  • Floating booms and trash interception system
  • Mechanized skimmer boats and conveyor offloading
  • In-situ aeration and bio-remediation where required
  • Material segregation and disposal/recycling linkage
  • Monthly impact dashboard with before/after visuals

📋 DPR / Proposal Deliverables

  • Site survey, influent/input characterization and capacity design basis
  • Process flow diagram, mass balance, hydraulic calculations and electrical load
  • Equipment list, layout, civil/mechanical/electrical interface and automation concept
  • CAPEX, OPEX, payback, revenue model, risk register and implementation schedule
  • Compliance matrix, permits, monitoring plan and post-commissioning O&M model
20
Chapter 20 · Industrial Waste Management Plants

INDUSTRIAL
WASTE
Management Plants

Industrial waste plants manage hazardous and non-hazardous waste through segregation, recovery, stabilization, treatment, storage, disposal and co-processing.

Industrial Waste Management Plants

Technology, capacity, finance and delivery clarity

Every chapter now has a related visual header, DPR-style assumptions, specifications and next-step implementation data without changing the EarthGuard theme.

Industrial Waste Management Plants visual
General Brief Description
INDUSTRIAL PROJECT MODEL

Industrial waste plants manage hazardous and non-hazardous waste through segregation, recovery, stabilization, treatment, storage, disposal and co-processing. The chapter includes a practical specification structure, deliverables and financial assumptions for board-level review and client presentation.

Capacity
5–500 TPD
Industrial estates, chemical clusters, pharma parks and manufacturing hubs.
Technologies
Sorting + stabilization + TSDF
Pre-processing, shredding, leachate treatment, lab analysis and tracking.
Treatment Goal
Compliance + recovery
Reduced landfill, proper manifest, co-processing and material recovery.
Financial Model
Gate fee + recovery
Tipping/gate fees, O&M, transportation, recovered material and co-processing revenue.

⚙️ Recommended Process Flow

  • Waste inventory and compatibility matrix
  • Segregated receiving, weighing and barcoding
  • Shredding, stabilization/solidification and secure storage
  • Leachate and wash-water treatment
  • Co-processing, recycling or secured landfill linkage
  • Digital manifest and compliance reporting

📋 DPR / Proposal Deliverables

  • Site survey, influent/input characterization and capacity design basis
  • Process flow diagram, mass balance, hydraulic calculations and electrical load
  • Equipment list, layout, civil/mechanical/electrical interface and automation concept
  • CAPEX, OPEX, payback, revenue model, risk register and implementation schedule
  • Compliance matrix, permits, monitoring plan and post-commissioning O&M model
21
Chapter 21 · Solid Waste Management Plants

SOLID WASTE
MANAGEMENT
Plants

Solid Waste Management Plants convert mixed municipal waste into separated recyclables, compost, RDF, biomethane and safely managed rejects.

Solid Waste Management Plants

Technology, capacity, finance and delivery clarity

Every chapter now has a related visual header, DPR-style assumptions, specifications and next-step implementation data without changing the EarthGuard theme.

Solid Waste Management Plants visual
General Brief Description
SOLID WASTE PROJECT MODEL

Solid Waste Management Plants convert mixed municipal waste into separated recyclables, compost, RDF, biomethane and safely managed rejects. The chapter includes a practical specification structure, deliverables and financial assumptions for board-level review and client presentation.

Capacity
10–2,000 TPD
Municipalities, smart cities, industrial townships and campuses.
Technologies
MRF + compost + RDF
Trommel, ballistic separation, composting, RDF, biomethanation and landfill.
Treatment Goal
Landfill diversion
High recycling rate, compost/RDF revenue and reduced dumping.
Financial Model
PPP + tipping fee
CAPEX grant/PPP, tipping fees, compost/RDF sales and O&M contracts.

⚙️ Recommended Process Flow

  • Door-to-door collection and segregation planning
  • MRF line with trommel, air classifier, magnets and balers
  • Wet waste composting or biomethanation
  • Dry rejects to RDF/co-processing
  • Leachate management and sanitary landfill for inert rejects
  • Weighbridge and digital municipal dashboard

📋 DPR / Proposal Deliverables

  • Site survey, influent/input characterization and capacity design basis
  • Process flow diagram, mass balance, hydraulic calculations and electrical load
  • Equipment list, layout, civil/mechanical/electrical interface and automation concept
  • CAPEX, OPEX, payback, revenue model, risk register and implementation schedule
  • Compliance matrix, permits, monitoring plan and post-commissioning O&M model
22
Chapter 22 · Multi-Media Recycling Plants

MULTI-MEDIA
RECYCLING
Plants

Multi-media recycling plants handle multiple categories of waste and convert them into saleable secondary raw materials for circular-economy supply chains.

Multi-Media Recycling Plants

Technology, capacity, finance and delivery clarity

Every chapter now has a related visual header, DPR-style assumptions, specifications and next-step implementation data without changing the EarthGuard theme.

Multi-Media Recycling Plants visual
General Brief Description
MULTI-MEDIA PROJECT MODEL

Multi-media recycling plants handle multiple categories of waste and convert them into saleable secondary raw materials for circular-economy supply chains. The chapter includes a practical specification structure, deliverables and financial assumptions for board-level review and client presentation.

Capacity
2–500 TPD
Plastic, e-waste, metal, glass, paper, wood, textile and C&D fractions.
Technologies
Sort + wash + shred + pelletize
Optical/manual sorting, washing, granulation, baling, magnetic separation.
Treatment Goal
Material recovery
EPR compliance, secondary raw material and lower virgin-material dependence.
Financial Model
Material revenue + EPR
Recovered material sales, EPR credits, processing fee and OEM contracts.

⚙️ Recommended Process Flow

  • Incoming material categorization and contamination control
  • Separate lines for plastic, paper, metal, glass, e-waste and C&D
  • Washing, drying, shredding, granulation and baling
  • Quality testing for moisture, ash, polymer grade and contamination
  • OEM/offtaker agreements and EPR documentation
  • Traceability dashboard for circular economy reporting

📋 DPR / Proposal Deliverables

  • Site survey, influent/input characterization and capacity design basis
  • Process flow diagram, mass balance, hydraulic calculations and electrical load
  • Equipment list, layout, civil/mechanical/electrical interface and automation concept
  • CAPEX, OPEX, payback, revenue model, risk register and implementation schedule
  • Compliance matrix, permits, monitoring plan and post-commissioning O&M model
23
Chapter 23 · Air Pollution Control Solutions

AIR POLLUTION
CONTROL
Solutions

Air pollution control systems reduce particulate matter, SOx, NOx, VOCs, acid gases, fumes and odours from industrial stacks and process emissions.

Air Pollution Control Solutions

Technology, capacity, finance and delivery clarity

Every chapter now has a related visual header, DPR-style assumptions, specifications and next-step implementation data without changing the EarthGuard theme.

Air Pollution Control Solutions visual
General Brief Description
AIR POLLUTION PROJECT MODEL

Air pollution control systems reduce particulate matter, SOx, NOx, VOCs, acid gases, fumes and odours from industrial stacks and process emissions. The chapter includes a practical specification structure, deliverables and financial assumptions for board-level review and client presentation.

Flow Range
1,000–500,000 m³/hr
Power, cement, steel, pharma, chemical, foundry and food industries.
Technologies
ESP / Baghouse / Scrubber / RTO
Selected by pollutant type, temperature, moisture and removal target.
Treatment Goal
Stack compliance
PM, SOx, NOx, VOC, odour and acid gas control with CEMS.
Financial Model
Retrofit + AMC
EPC, performance tests, filter media, spares, CEMS and annual service.

⚙️ Recommended Process Flow

  • Emission inventory and stack/process audit
  • Technology selection: ESP, baghouse, scrubber, RTO, FGD, VOC adsorption
  • Ducting, fan, chimney, instrumentation and control panel
  • CEMS/OCEMS integration for real-time reporting
  • Performance guarantee testing and SPCB documentation
  • Spare parts, bag replacement, media and AMC programme

📋 DPR / Proposal Deliverables

  • Site survey, influent/input characterization and capacity design basis
  • Process flow diagram, mass balance, hydraulic calculations and electrical load
  • Equipment list, layout, civil/mechanical/electrical interface and automation concept
  • CAPEX, OPEX, payback, revenue model, risk register and implementation schedule
  • Compliance matrix, permits, monitoring plan and post-commissioning O&M model
24
Chapter 24 · 10-Year Financial Projections & Complete DPR

10-YEAR
FINANCIAL
DPR Model

A dedicated DPR chapter now provides product-wise 10-year projections, CAPEX/OPEX assumptions, charts, revenue mix and a complete DPR presentation framework for each plant and service category.

Financial planning and DPR dashboard
10-Year Financial Projections & Complete DPR

Technology, capacity, finance and delivery clarity

Every chapter now has a related visual header, DPR-style assumptions, specifications and next-step implementation data without changing the EarthGuard theme.

Product-wise 10-Year Financial Model
CLEAR FINANCIAL PROJECTIONS

The following is a strict planning model for presentation and internal DPR development. It is not an audited forecast. It should be finalized after actual site pipeline, signed MOUs, state tender calendars, plant capacity, land/civil scope, feed quality, regulatory approvals, working-capital limits and financing terms are confirmed.

Water / ETP / ZLD Mix

Largest FY2035 base-case revenue pool from STP, WTP, WWTP, industrial WTP, ETP and ZLD.

Waste / Recycling / Bio-CNG

MRTP/MRCS, SWM, industrial waste, recycling and Bio-CNG project portfolio.

Air + IoT Monitoring

Air pollution control systems, CEMS/OCEMS and environmental IoT dashboards.

Consulting + Carbon

EIA, ESG, BRSR, carbon credits, PES and climate-finance advisory.

FY2035 Revenue Mix — Base Case
Water/STP/ETP/ZLD
₹318.3 Cr
Waste/Recycling/Bio-CNG
₹195.1 Cr
Air/IoT
₹92.4 Cr
Consulting/ESG/Carbon
₹125.5 Cr
Product / ServiceFY26FY27FY28FY29FY30FY31FY32FY33FY34FY3510-Year TotalCAGR UsedIndicative EBITDA Margin
Sewage Treatment Plants
SBR, MBBR, MBR, UASB + polishing
₹8.0 Cr₹9.8 Cr₹11.9 Cr₹14.5 Cr₹17.7 Cr₹21.6 Cr₹26.4 Cr₹32.2 Cr₹39.3 Cr₹47.9 Cr₹229.3 Cr22%32–38%
Water Treatment Plants
Clarifier, PSF, ACF, UF/RO, disinfection
₹6.0 Cr₹7.2 Cr₹8.6 Cr₹10.4 Cr₹12.4 Cr₹14.9 Cr₹17.9 Cr₹21.5 Cr₹25.8 Cr₹31.0 Cr₹155.7 Cr20%24–30%
Waste Water Treatment Plants
Primary + biological + tertiary reuse
₹9.0 Cr₹11.0 Cr₹13.4 Cr₹16.3 Cr₹19.9 Cr₹24.3 Cr₹29.7 Cr₹36.2 Cr₹44.2 Cr₹53.9 Cr₹257.9 Cr22%26–34%
Industrial Water Treatment Plants
RO/DM/softener/UF/EDI/cooling treatment
₹7.0 Cr₹8.5 Cr₹10.2 Cr₹12.4 Cr₹15.0 Cr₹18.2 Cr₹22.0 Cr₹26.6 Cr₹32.2 Cr₹38.9 Cr₹191.0 Cr21%24–32%
Effluent Treatment Plants
Equalization, DAF, biological, tertiary
₹12.0 Cr₹14.8 Cr₹18.2 Cr₹22.3 Cr₹27.5 Cr₹33.8 Cr₹41.6 Cr₹51.1 Cr₹62.9 Cr₹77.3 Cr₹361.5 Cr23%28–36%
Zero Liquid Discharge Systems
UF/RO/MEE/ATFD/crystallizer
₹10.0 Cr₹12.4 Cr₹15.4 Cr₹19.1 Cr₹23.6 Cr₹29.3 Cr₹36.4 Cr₹45.1 Cr₹55.9 Cr₹69.3 Cr₹316.5 Cr24%22–32%
Mechanical River Treatment & Cleaning
Trash skimmers, screens, aeration, floating booms
₹4.0 Cr₹5.0 Cr₹6.4 Cr₹8.0 Cr₹10.1 Cr₹12.7 Cr₹16.0 Cr₹20.2 Cr₹25.4 Cr₹32.0 Cr₹139.8 Cr26%30–40%
Industrial Waste Management Plants
Sorting, stabilization, TSDF, co-processing
₹8.0 Cr₹9.6 Cr₹11.5 Cr₹13.8 Cr₹16.6 Cr₹19.9 Cr₹23.9 Cr₹28.7 Cr₹34.4 Cr₹41.3 Cr₹207.7 Cr20%26–34%
Solid Waste Management Plants
MRF, compost, RDF, biomethanation
₹7.0 Cr₹8.3 Cr₹9.7 Cr₹11.5 Cr₹13.6 Cr₹16.0 Cr₹18.9 Cr₹22.3 Cr₹26.3 Cr₹31.0 Cr₹164.6 Cr18%24–32%
Multi-Media Recycling Plants
Plastic, e-waste, metal, glass, paper, C&D
₹6.0 Cr₹7.5 Cr₹9.4 Cr₹11.7 Cr₹14.6 Cr₹18.3 Cr₹22.9 Cr₹28.6 Cr₹35.8 Cr₹44.7 Cr₹199.5 Cr25%30–42%
Air Pollution Control Solutions
ESP, baghouse, scrubber, RTO, FGD, CEMS
₹9.0 Cr₹10.9 Cr₹13.2 Cr₹15.9 Cr₹19.3 Cr₹23.3 Cr₹28.2 Cr₹34.2 Cr₹41.4 Cr₹50.0 Cr₹245.4 Cr21%25–35%
IoT Environmental Monitoring
OCEMS, SCADA, AI dashboards, sensors
₹4.0 Cr₹5.2 Cr₹6.8 Cr₹8.8 Cr₹11.4 Cr₹14.9 Cr₹19.3 Cr₹25.1 Cr₹32.6 Cr₹42.4 Cr₹170.5 Cr30%45–60%
Environmental Consulting, EIA & ESG
EIA, audits, BRSR, GRI, TCFD, ISO 14001
₹12.0 Cr₹14.4 Cr₹17.3 Cr₹20.7 Cr₹24.9 Cr₹29.9 Cr₹35.8 Cr₹43.0 Cr₹51.6 Cr₹61.9 Cr₹311.5 Cr20%38–50%
Carbon Credits & Climate Finance
VCS, Gold Standard, ICM, PES, green bonds
₹6.0 Cr₹7.8 Cr₹10.1 Cr₹13.2 Cr₹17.1 Cr₹22.3 Cr₹29.0 Cr₹37.6 Cr₹48.9 Cr₹63.6 Cr₹255.6 Cr30%42–55%
Bio-CNG & Organic Waste Energy
AD, gas purification, compression, compost
₹5.0 Cr₹6.4 Cr₹8.2 Cr₹10.5 Cr₹13.4 Cr₹17.2 Cr₹22.0 Cr₹28.1 Cr₹36.0 Cr₹46.1 Cr₹192.9 Cr28%25–37%
TOTAL BASE CASE₹113.0 Cr₹138.8 Cr₹170.3 Cr₹209.1 Cr₹257.1 Cr₹316.6 Cr₹390.0 Cr₹480.5 Cr₹592.7 Cr₹731.3 Cr₹3399.4 Cr~23%Blended 29–38%
Unit Economics / DPR Costing Assumptions
CAPEX, OPEX & REVENUE CALCULATION BASE
ProductIndicative CAPEX BenchmarkIndicative OPEX BenchmarkRevenue StreamsFinancial Note
STP₹0.35–1.20 Cr/MLD₹8–18 lakh/MLD/yearDesign+EPC+O&M, AMCs, treated water reuse, sludge management12–24 months project cash cycle for EPC + 3–10 year O&M
WTP₹0.25–0.75 Cr/MLD₹5–14 lakh/MLD/yearEPC, consumables, membranes/media replacement, O&MMunicipal and industrial recurring service potential
WWTP₹0.50–1.80 Cr/MLD₹10–22 lakh/MLD/yearDPR, EPC, automation, reuse network, O&MHigh municipal PPP potential
Industrial WTP₹0.40–1.50 Cr/MLD₹8–20 lakh/MLD/yearBoiler/cooling/process water, chemicals, membrane AMCRepeat orders from industrial clusters
ETP₹0.50–2.50 Cr/MLD₹12–35 lakh/MLD/yearIndustry-specific process engineering, performance guarantees, O&MHigh margin design due to effluent complexity
ZLD₹3.00–9.00 Cr/MLD₹0.60–1.80 Cr/MLD/yearHigh-recovery RO, MEE, ATFD, salt management, auditPremium compliance product with capex financing potential
MRTP/MRCS₹0.75–4.00 Cr per package₹12–60 lakh/yearRiver/pond cleaning fleet, booms, operation teams, data reportingCity contracts + CSR + riverfront authorities
Industrial Waste₹1.50–12.00 Cr/plant₹0.50–4.00 Cr/yearTreatment, storage, disposal, co-processing and manifest complianceCluster-level industrial opportunity
Solid Waste₹2.00–40.00 Cr/plant₹0.75–10.00 Cr/yearMRF, compost, RDF, biomethanation, landfill, O&MMunicipal PPP and tipping-fee models
Recycling₹1.00–20.00 Cr/line₹0.30–5.00 Cr/yearPlastic/e-waste/paper/glass/metal/C&D lines with material revenueLinked to EPR and circular economy procurement
Air Control₹0.50–25.00 Cr/system₹8–75 lakh/yearESP, baghouse, scrubbers, RTO, FGD, CEMS, AMCRegulatory renewal and retrofit market
DPR Structure
COMPLETE DPR PRESENTATION FRAMEWORK

1. Executive & Project Brief

Client, location, capacity, design horizon, regulatory objective, service level, product/offtake target and project success KPIs.

2. Baseline Data Collection

Flow/input data, sampling results, land availability, utilities, civil constraints, environmental sensitivity, existing assets and stakeholder map.

3. Technology Selection

Options comparison, process guarantee, energy/chemical demand, footprint, automation requirement, redundancy and maintainability.

4. Engineering Design

PFD, P&ID, hydraulic profile, mass balance, equipment schedule, civil layout, electrical load, SCADA/IoT and safety provisions.

5. Financial Model

CAPEX, OPEX, revenue, subsidy, financing mix, depreciation, working capital, EBITDA, payback, DSCR, IRR and sensitivity analysis.

6. Implementation Plan

Permits, tender packaging, procurement, construction, commissioning, training, performance test, handover and O&M governance.

Final statutory DPR values must be verified by laboratory analysis, contour survey, vendor quotations, site-specific civil scope, local power tariffs, labour cost, disposal/offtake contracts and government approvals.
Data sources used for scope framing: Jigisha Envirocare website service categories; CPCB/PIB sewage capacity gap; PIB CETP status; India wastewater, waste management and air-pollution-control market summaries; global environmental consulting and water/wastewater market summaries. External industry numbers are used for opportunity sizing only; project-level pricing remains site-specific.
26
Chapter 26 · Contact & Consultation

CONTACT
US &
Enquire

Begin your environmental transformation today. Whether you need an EIA for a new project, a ZLD system for your factory, PFAS remediation for a contaminated site, carbon credits for your sustainability report, or a Bio-CNG plant for your agricultural waste — JEPL responds within 2 business days.

Professional consultation office
Enquiry Desk

Submit project files securely

Upload drawings, PDFs, Word, Excel and images with the strict-mode enquiry form configured for info@jigisha.group.

Submit Enquiry
GET CONSULTATION
Supported formats: JPG, JPEG, PNG, AutoCAD DWG/DXF, PDF, Word DOC/DOCX, Excel XLS/XLSX. Maximum recommended size: 20 MB.
STATUS PANEL READY — Fill the required fields, attach an optional project file, and submit. The enquiry is configured to send to info@jigisha.group.
Direct Contact
REACH JEPL
Registered Address

Jigisha Envirocare Pvt. Ltd.

A Subsidiary of Jigisha GroupOf Companies
Ahmedabad, Gujarat — India
(R&D Hub: Bengaluru · Manufacturing: Bhopal/Noida)

Service-Specific Contacts
EIA & Consultingeia@jigishaenvirocare.in
Technology (ZLD/ETP/Air)tech@jigishaenvirocare.in
PFAS Remediationpfas@jigishaenvirocare.in
Carbon & ESGesg@jigishaenvirocare.in
Bio-CNG Projectsbiocng@jigishaenvirocare.in
Water Solutionswater@jigishaenvirocare.in
International Projectsglobal@jigishaenvirocare.in
General Enquiryhello@jigishaenvirocare.in
Free Services Available
  • 🌿 Free initial environmental compliance assessment
  • 🔬 Free PFAS risk screening consultation
  • 💧 Free ZLD feasibility quick assessment
  • 📊 Free carbon footprint quick estimate (Scope 1&2)
  • ⛽ Free Bio-CNG DPR scope & investment overview
Certifications & Affiliations
ISO 14001MoEF&CC CPCBNABL Verra VCSGold Standard TCFDGRI BRSRSBTi
Digital Presence

🌐 www.jigisha.co.in
🌿 www.jigishaenvirocare.in
📧 info@jigisha.group

Connect With Us
SOCIAL MEDIA & QUICK CONNECT
📘
Facebook
@JigishaEnvirocare
📸
Instagram
@jigisha.envirocare
▶️
YouTube
Jigisha Envirocare
💼
LinkedIn
Jigisha Envirocare Pvt. Ltd.
💬
WhatsApp
Quick Enquiry Line
Official Environmental Technology Magazine — Vol 1, Issue 1 — 2026
JIGISHA
ENVIROCARE
PVT. LTD.

"By combining environmental consulting, technology-enabled remediation, carbon-finance integration, and global project delivery capability, Jigisha Envirocare addresses a multi-hundred-billion-dollar opportunity with high-margin, sustainable outcomes."

Parent Company

A Subsidiary of Jigisha GroupOf Companies
Part of the Jigisha Group of Companies.
19+ subsidiaries · 180+ countries · Mission Gold Bird India

EIA · PFAS · ZLD · Bio-CNG · IoT · Carbon · ESG · Water

jigishaenvirocare.in
jigisha.co.in
info@jigisha.group
EIA & ConsultingPFAS RemediationZLD SystemsBio-CNG Plants Carbon CreditsESG ReportingIoT MonitoringAir Pollution Control Wastewater TreatmentDesalinationSmart WaterCircular Economy

© 2026 Jigisha Envirocare Pvt. Ltd. · A Subsidiary of Jigisha GroupOf Companies
All specifications and projections subject to change. All trademarks acknowledged. This document is for information and business development purposes only.